![]() Lockridge Okoth
Lockridge Okoth
FXStreet
Bitcoin (BTC) price is on a downtrend, recording d three consecutive red candlesticks. This bearishness has diffused to Ethereum (ETH) and Ripple (XRP) prices and comes at a time when the BTC Exchange Traded Fund (ETF) bubble has burst before the eyes of traders and investors as the US Securities and Exchange Commission put off a decision concerning Cathie Wood's Ark Invest.
Also Read: Bitcoin Weekly Forecast: US SEC likely to reject BTC ETF, experts say
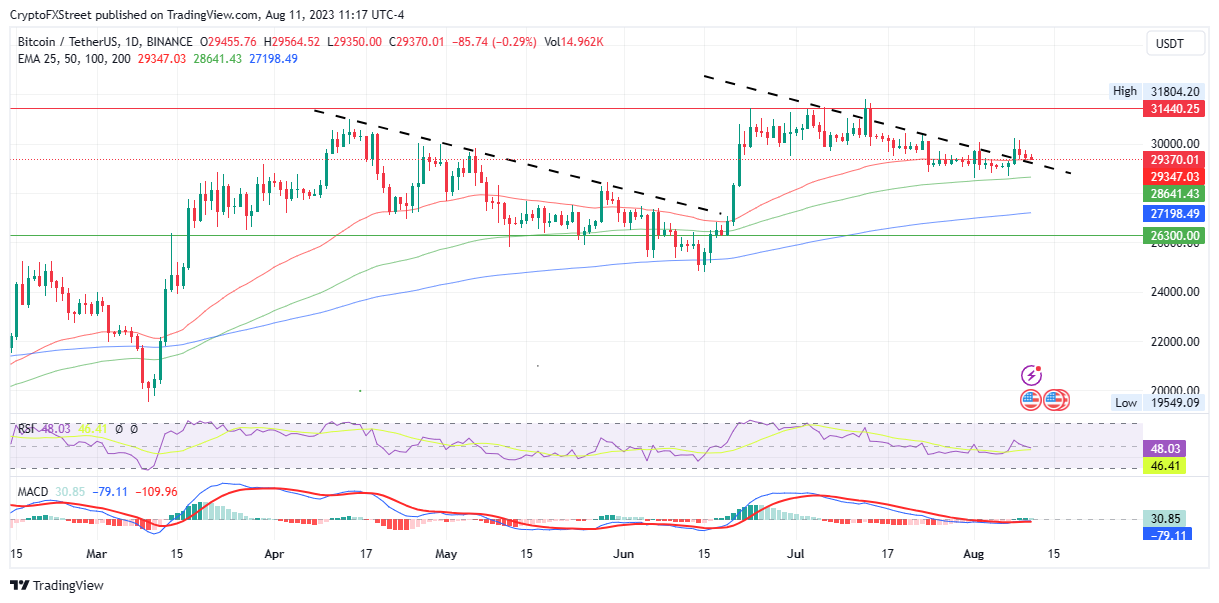
Bitcoin (BTC) price has been sitting on the 50-day Exponential Moving Average (EMA) at $29,348 since August 9. However, this support oasis may be running dry as the weekend sets in because of the retail tendency to relax their trading hands around that time.
Accordingly, Bitcoin price could slide below the 50-day EMA back under the descending trendline to continue its downtrend. Without a strong catalyst to trigger impulse, the people's crypto could extend south to test the 100-day EMA at $28,641 or, in a dire case, the 200-day EMA at $27,198. This is likely considering speculation of the US SEC likely rejecting BTC ETF applications.
The nose-diving Relative Strength Index (RSI), whose direction is interpreted as falling momentum, reinforces this outlook. Similarly, the Moving Average Convergence Divergence (MACD) is in the negative zone, which points to the presence of stronger bears than bulls in the market currently.
BTC/USDT 1-day chart
Conversely, with the weekend setting in, large holders are likely to step in, amassing or offloading BTC in huge chunks and cash in the weekend price swings. Former Morgan Stanley technical strategist Mark Newton supports this dynamic, saying:
We're seeing above-average volatility on weekends with it moving dramatically up or down… the size of individual orders is usually big with overall fewer orders. It indicates that the large holders of the cryptocurrency, so-called bitcoin whales, are active during the weekend to amass or offload bitcoins in big numbers and cash in the weekend price swings.
If they buy, Bitcoin price could extend north, potentially tagging the $31,440 resistance level or shattering past and recording a new range high.
Also Read: Bitcoin and altcoin prices could benefit from cooling inflation, US PPI for July exceeds expectations.
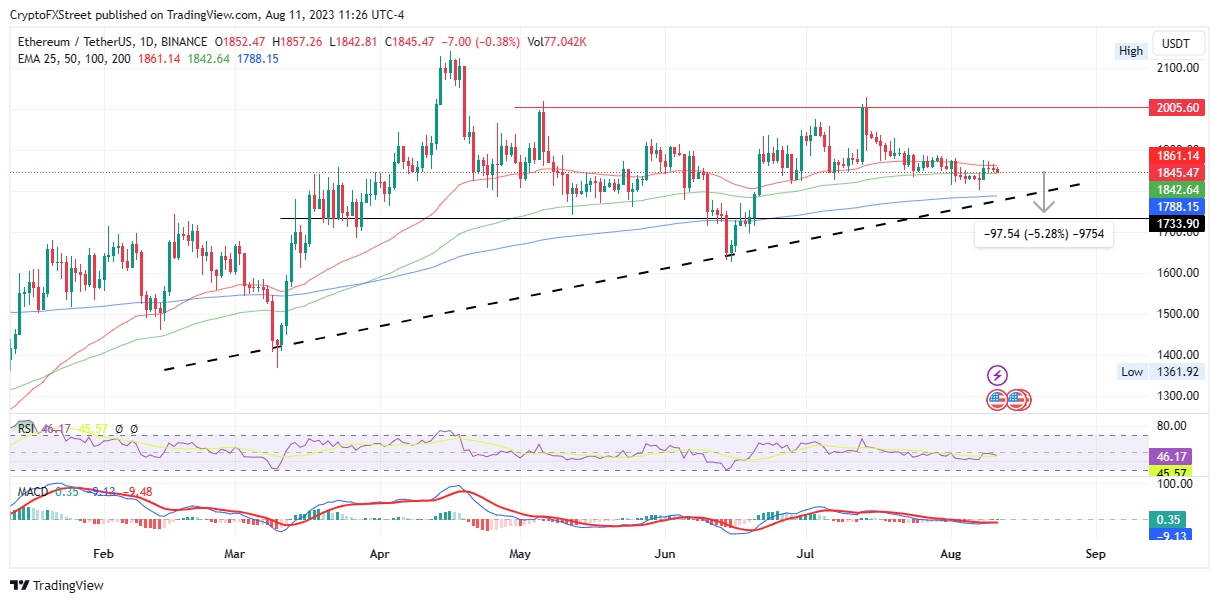
Ethereum (ETH) price is suffering because it is correlated to BTC, meaning it suffers the initial impact of a weakening Bitcoin before the ripples reach the rest of the altcoin community. Thus, if BTC slides below the downtrend line, ETH could follow suit to lose the support offered by the 100-day EMA at $1,842.
The subsequent selling pressure could see Ethereum price retest the 200-day EMA at $1,788 or, in the extreme case, test the $1,733 support level. Such a move would constitute a 5% drop from current levels.
Notably, the RSI for Ethereum price is showing the same waning momentum as that of Bitcoin price, just as the MACD is in the negative zone. This adds credence to the bearish thesis.
ETH/USDT 1-day chart
On the flipside, a new resolve among bulls could send Ethereum price north, breaking out from below the foothold of the 50-day EMA for a chance to test the $2,005 resistance level. This would denote a 10% leap above current levels.
It is worth mentioning that on-chain metrics point to an incoming rally for Ethereum price, including the low supply of tokens deposited into exchanges. This is often interpreted as a sign of increasing buying pressure, while the fact that there is increasing whale accumulation also hints at a potential increase in prices. Find details here.
Also Read: Ethereum's low volatility and bullish on-chain metrics hint at potential ETH price rally
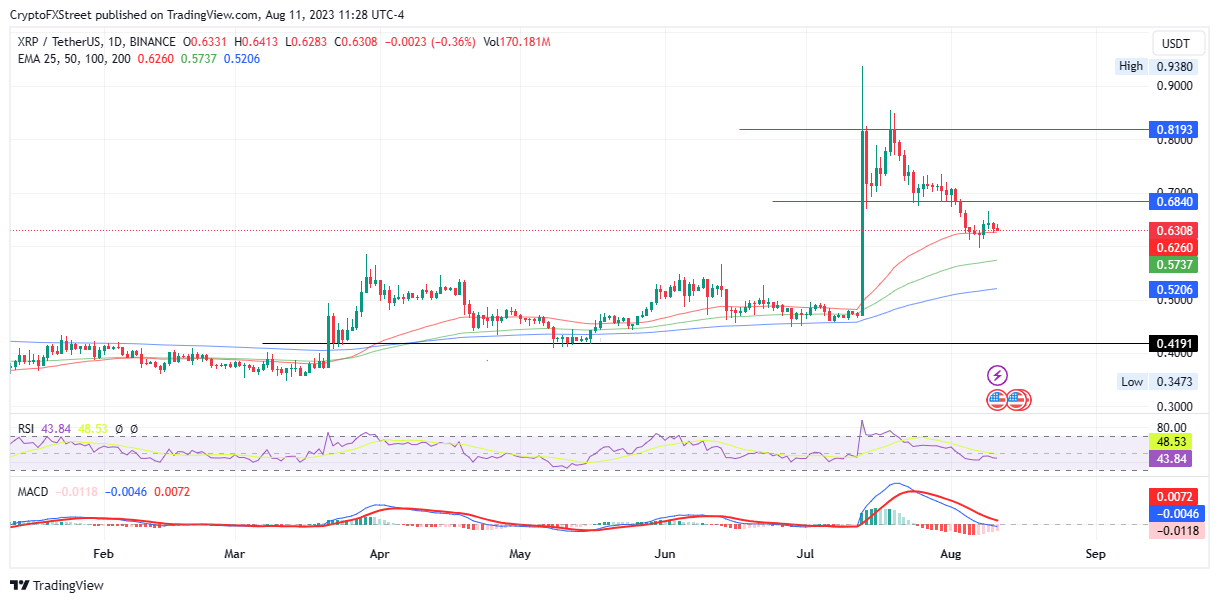
Ripple (XRP) price has been sitting on the 50-day EMA at $0.6308 for seven consecutive days, a risky stunt considering markets tend not to wait for so long. With broader crypto market momentum fading, chances of a slump increase, which could see the remittance token drop to the 100-day EMA at $0.5737. In a highly bearish case, the altcoin could slump further to test the $0.5206 support level.
The RSI and MACD are also nose-diving, suggesting a falling momentum that could lower Ripple price.

XRP/USDT 1-day chart
On the other hand, bullish momentum could restore as Ripple price collects leftover liquidity from the past few days. The stability that follows and ensuing buying pressure could fuel an uptrend, possibly past the $0.6840 resistance level, or in a highly ambitious case, tag the $0.8193 resistance level. This would represent a 30% flight above present levels.
Also Read: XRP rallies to $50 on Gemini, Ripple holders speculate the outcome of SEC appeal against Judge Torres' ruling
Ripple is a payments company that specializes in cross-border remittance. The company does this by leveraging blockchain technology. RippleNet is a network used for payments transfer created by Ripple Labs Inc. and is open to financial institutions worldwide. The company also leverages the XRP token.
XRP is the native token of the decentralized blockchain XRPLedger. The token is used by Ripple Labs to facilitate transactions on the XRPLedger, helping financial institutions transfer value in a borderless manner. XRP therefore facilitates trustless and instant payments on the XRPLedger chain, helping financial firms save on the cost of transacting worldwide.
XRPLedger is based on a distributed ledger technology and the blockchain using XRP to power transactions. The ledger is different from other blockchains as it has a built-in inflammatory protocol that helps fight spam and distributed denial-of-service (DDOS) attacks. The XRPL is maintained by a peer-to-peer network known as the global XRP Ledger community.
XRP uses the interledger standard. This is a blockchain protocol that aids payments across different networks. For instance, XRP’s blockchain can connect the ledgers of two or more banks. This effectively removes intermediaries and the need for centralization in the system. XRP acts as the native token of the XRPLedger blockchain engineered by Jed McCaleb, Arthur Britto and David Schwartz.
Information on these pages contains forward-looking statements that involve risks and uncertainties. Markets and instruments profiled on this page are for informational purposes only and should not in any way come across as a recommendation to buy or sell in these assets. You should do your own thorough research before making any investment decisions. FXStreet does not in any way guarantee that this information is free from mistakes, errors, or material misstatements. It also does not guarantee that this information is of a timely nature. Investing in Open Markets involves a great deal of risk, including the loss of all or a portion of your investment, as well as emotional distress. All risks, losses and costs associated with investing, including total loss of principal, are your responsibility. The views and opinions expressed in this article are those of the authors and do not necessarily reflect the official policy or position of FXStreet nor its advertisers. The author will not be held responsible for information that is found at the end of links posted on this page.
If not otherwise explicitly mentioned in the body of the article, at the time of writing, the author has no position in any stock mentioned in this article and no business relationship with any company mentioned. The author has not received compensation for writing this article, other than from FXStreet.
FXStreet and the author do not provide personalized recommendations. The author makes no representations as to the accuracy, completeness, or suitability of this information. FXStreet and the author will not be liable for any errors, omissions or any losses, injuries or damages arising from this information and its display or use. Errors and omissions excepted.
The author and FXStreet are not registered investment advisors and nothing in this article is intended to be investment advice.
Join Telegram
Join Telegram
Bitcoin price has been moving sideways for nearly 50 days now, with no directional bias in sight. With volatility hitting all-time lows, investors are bored out of their minds and are looking at other avenues for trading opportunities.
XRP witnessed a massive price rally and hit $50 on Gemini exchange platform. The relisting announcement by Gemini was received with enthusiasm in the crypto community.
Dogecoin price continues to trade below a declining trendline that serves as resistance for more than nine months. As DOGE slithers close to this hurdle and knocks on it, it is a clear sign of an attempted breakout.
Some of Ethereum’s on-chain metrics have flipped bullish recently, at a moment when the volatility of the altcoin’s price has hit a record low, according to data from IntoTheBlock.
Bitcoin price has been moving sideways for nearly 50 days now, with no directional bias in sight. With volatility hitting all-time lows, investors are bored out of their minds and are looking at other avenues for trading opportunities.
Note: All information on this page is subject to change. The use of this website constitutes acceptance of our user agreement. Please read our privacy policy and legal disclaimer.
Trading foreign exchange on margin carries a high level of risk and may not be suitable for all investors. The high degree of leverage can work against you as well as for you. Before deciding to trade foreign exchange you should carefully consider your investment objectives, level of experience and risk appetite. The possibility exists that you could sustain a loss of some or all of your initial investment and therefore you should not invest money that you cannot afford to lose. You should be aware of all the risks associated with foreign exchange trading and seek advice from an independent financial advisor if you have any doubts.
Opinions expressed at FXStreet are those of the individual authors and do not necessarily represent the opinion of FXStreet or its management. FXStreet has not verified the accuracy or basis-in-fact of any claim or statement made by any independent author: errors and omissions may occur. Any opinions, news, research, analyses, prices or other information contained on this website, by FXStreet, its employees, clients or contributors, is provided as general market commentary and does not constitute investment advice. FXStreet will not accept liability for any loss or damage, including without limitation to, any loss of profit, which may arise directly or indirectly from use of or reliance on such information.


