![]() Lockridge Okoth
Lockridge Okoth
FXStreet
Bitcoin (BTC) price is trading without a directional bias, closing the week in a consolidation mode while extending the same aura to Ethereum (ETH) and Ripple (XRP) prices. The outlook leaves investors cautious and the circumspect could extend into the weekend, which is known for low trading volume.
Also Read: Bitcoin Weekly Forecast: BTC could revisit $21,000 as sell signals multiply ahead of US CPI.
Bitcoin (BTC) price is moving west, consolidating within a narrow range after breaking below a crucial support level during the August 17 crash. With weekends known to be rather lulled, the odds of a move north are slim unless large holders act.
The $24,995 support level is a ‘make-or-break’ for Bitcoin price. A decisive break below would send BTC to the psychological $24,000 and mark a bearish shift in trend. In the dire case, seller momentum could see the king of crypto hit $21,915, levels last seen around mid-March.
Both the Moving Average Convergence Divergence (MACD) indicator and the RSI recently gave buy signals. The RSI rose out of oversold territory at the end of August and the MACD line crossed above its signal line in negative territory at the same time. Despite these signals only reflecting a brief dead-cat bounce in price that quickly fell back at the start of September, there is still a possibility of a recovery evolving. 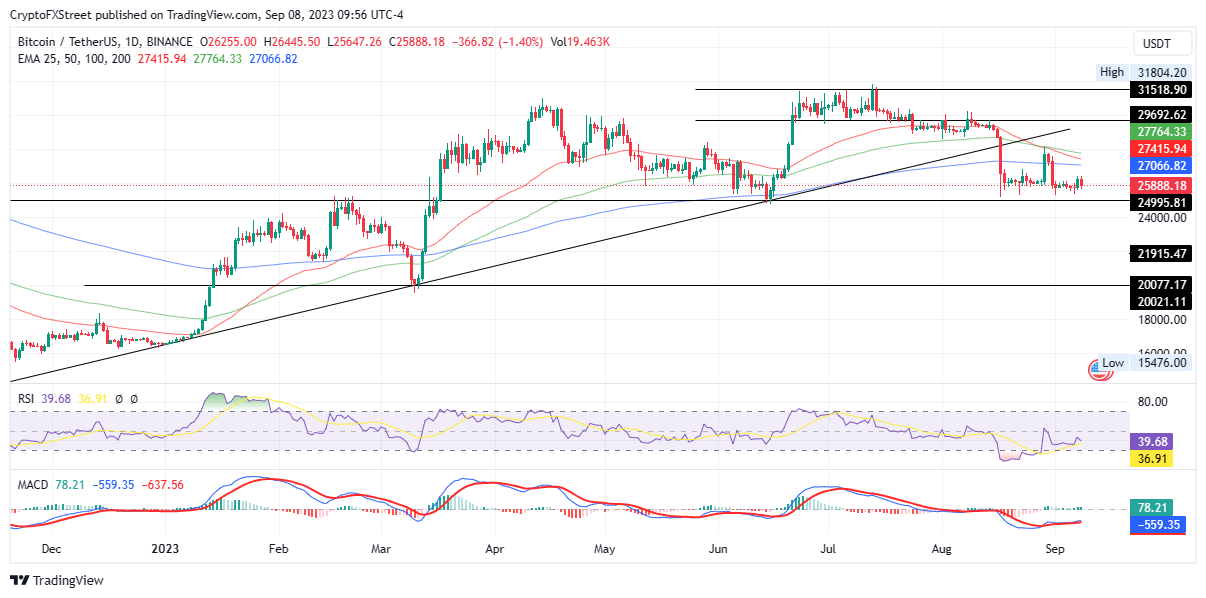
BTC/USDT 1-day chart
A resurgence by the bulls could provide such an impetus for Bitcoin price, fueling a recovery to the upside. Such a move could send BTC above the 200-, 50-, and eventually the 100-day Exponential Moving Average (EMA) at $27,066, $27,414, and $27,763 levels before ultimately restoring above the support offered by the ascending trendline at $29,692.
In a highly ambitious case, Bitcoin price could foray into the zone above the psychological $30,000 before tagging $31,518. While the possibility for a northbound move remains bleak in the near term, it would constitute a 20% climb above current levels.
Also Read: Bitcoin all-time high in 2025? BTC price idea reveals 'bull run launch’
Ethereum (ETH) price is testing the $1,621 support level, which is shaky ground, considering momentum is fading.
A drop below this buyer congestion level with a lot of uncollected liquidity hanging beneath could see ETH test the $1,529 support level. 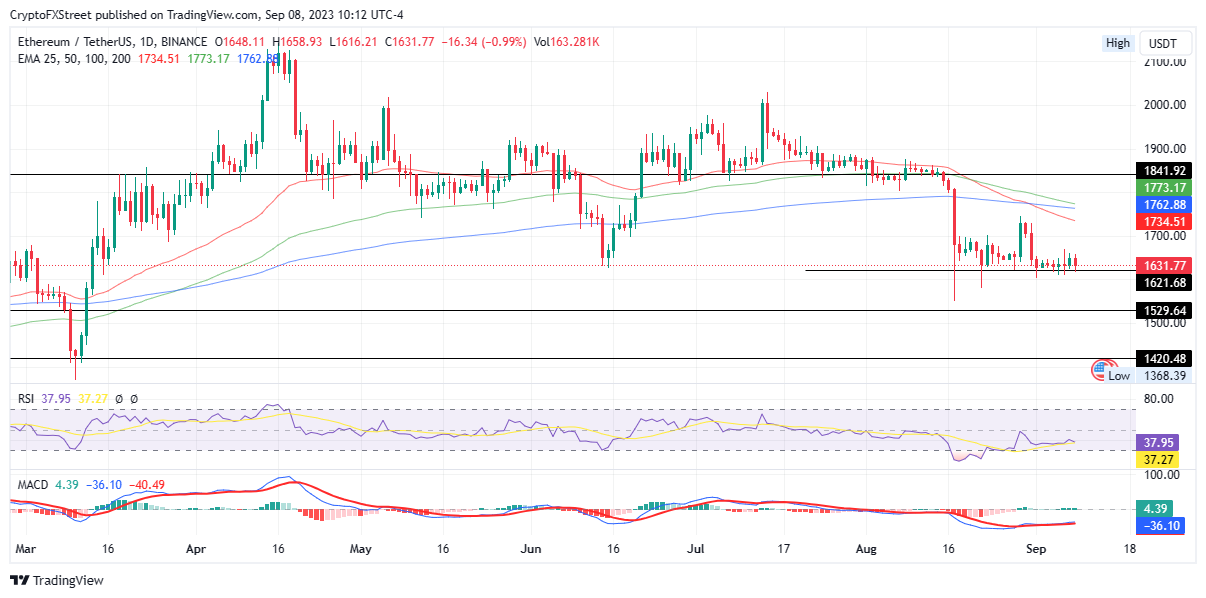
ETH/USDT 1-day chart
Conversely, revitalized momentum among bulls could see Ethereum price pivot at $1,621 before forging north to the 50-day EMA at $1,734. The ascension could extend, possibly reaching the area where the 200- and 100-day EMAs appear to converge at $1,762 and $1,773, respectively.
With the right momentum, inspired by a strong move by Bitcoin, the price could see Ethereum price hit $1,841, an area last tested on August 15.
Also Read: Ethereum whales accumulate ETH as researchers explore scaling beyond EIP-4844.
Ripple (XRP) price has broken out from a descending parallel channel after the exhaustion blow-off move lower on August 17. These are both bullish signs that the downtrend has finished. Further confirmation would be provided should the remittance token record a daily candlestick close above the 200-day EMA at $0.5233.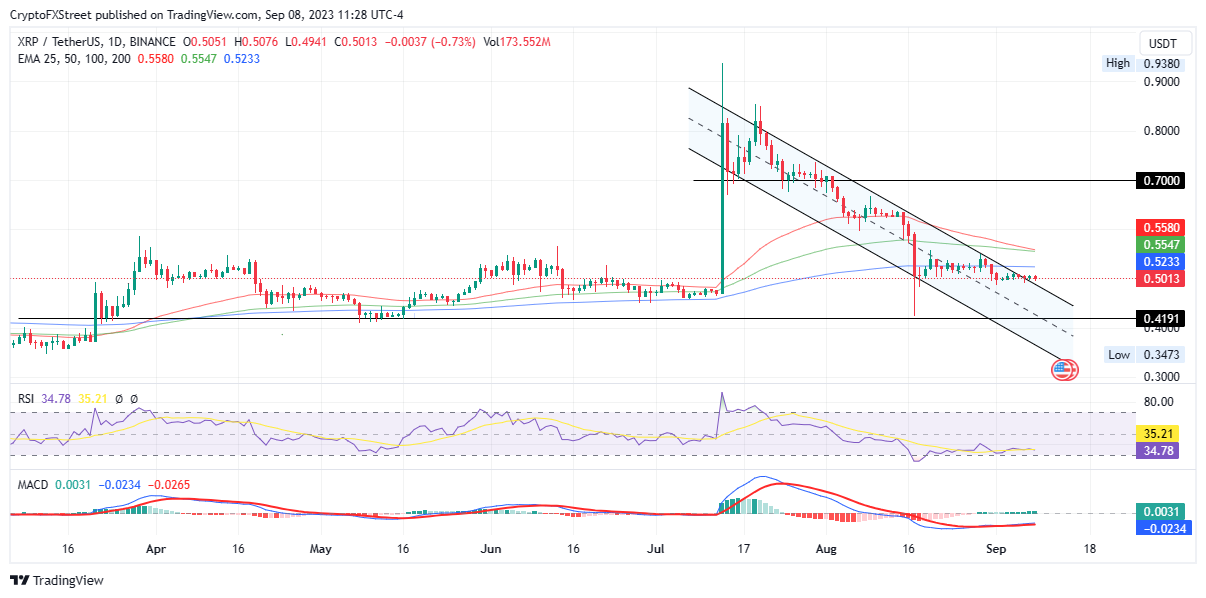
XRP/USDT 1-day chart
If sidelined investors or late buyers come in, the increased buying momentum could see Ripple price tag, or in a highly bullish case, overcome the resistance presented by the confluence resistance area between the 100-day and 50-day EMAs at $0.5547 and $0.5580 levels respectively.
Overcoming these hurdles could clear the way for Ripple price to reach the psychological $0.7000 level. This would indicate a 15% drop.
From a bearish perspective, there is still a risk Ripple price could slip back below the upper boundary of the descending channel and potentially extend to the July 13 lows around $0.4600. This would represent an 8% fall. In a dire case, Ripple price could extend to the midline of the bearish technical formation at $0.4191.
Also Read: XRP price likely to slump as pro-XRP attorney Deaton analyzes the Howey memo and Hinman speech
Ripple is a payments company that specializes in cross-border remittance. The company does this by leveraging blockchain technology. RippleNet is a network used for payments transfer created by Ripple Labs Inc. and is open to financial institutions worldwide. The company also leverages the XRP token.
XRP is the native token of the decentralized blockchain XRPLedger. The token is used by Ripple Labs to facilitate transactions on the XRPLedger, helping financial institutions transfer value in a borderless manner. XRP therefore facilitates trustless and instant payments on the XRPLedger chain, helping financial firms save on the cost of transacting worldwide.
XRPLedger is based on a distributed ledger technology and the blockchain using XRP to power transactions. The ledger is different from other blockchains as it has a built-in inflammatory protocol that helps fight spam and distributed denial-of-service (DDOS) attacks. The XRPL is maintained by a peer-to-peer network known as the global XRP Ledger community.
XRP uses the interledger standard. This is a blockchain protocol that aids payments across different networks. For instance, XRP’s blockchain can connect the ledgers of two or more banks. This effectively removes intermediaries and the need for centralization in the system. XRP acts as the native token of the XRPLedger blockchain engineered by Jed McCaleb, Arthur Britto and David Schwartz.
Information on these pages contains forward-looking statements that involve risks and uncertainties. Markets and instruments profiled on this page are for informational purposes only and should not in any way come across as a recommendation to buy or sell in these assets. You should do your own thorough research before making any investment decisions. FXStreet does not in any way guarantee that this information is free from mistakes, errors, or material misstatements. It also does not guarantee that this information is of a timely nature. Investing in Open Markets involves a great deal of risk, including the loss of all or a portion of your investment, as well as emotional distress. All risks, losses and costs associated with investing, including total loss of principal, are your responsibility. The views and opinions expressed in this article are those of the authors and do not necessarily reflect the official policy or position of FXStreet nor its advertisers. The author will not be held responsible for information that is found at the end of links posted on this page.
If not otherwise explicitly mentioned in the body of the article, at the time of writing, the author has no position in any stock mentioned in this article and no business relationship with any company mentioned. The author has not received compensation for writing this article, other than from FXStreet.
FXStreet and the author do not provide personalized recommendations. The author makes no representations as to the accuracy, completeness, or suitability of this information. FXStreet and the author will not be liable for any errors, omissions or any losses, injuries or damages arising from this information and its display or use. Errors and omissions excepted.
The author and FXStreet are not registered investment advisors and nothing in this article is intended to be investment advice.
Join Telegram
Join Telegram
Polkadot seems to be ending its downtrend after shedding 92.91% in the last two years from its all-time high of $55.09. In the last three days, DOT has inflated by 3.3%, breaching a declining trendline and confirming the potential start of an uptrend.
Floki Inu price rallied nearly 20% on September 30 but closed the candlestick with a 12% gain. The recent uptick opens the possibility of a 30% rally for FLOKI holders. A daily candlestick close below the $0.0000160 level would invalidate the bullish thesis.
Binance Coin (BNB) price has been in a tight consolidation for nearly six weeks. But the range tightening could end soon, potentially allowing bulls to take over and attempt to flip multiple hurdles standing in their way.
Solana (SOL) price seems to be undoing the bearish pressure that has kept it subdued all this time. The recent spike in buying pressure has pushed SOL to produce a higher high on the three-day chart, signaling a shift in momentum favoring bulls.
Bitcoin (BTC) price remains unfazed even after the multiple spot BTC ETF delays from the US Securities & Exchange Commission (SEC). But investors need to be careful with the ongoing BTC rally as it could be a trap for early bulls.
Note: All information on this page is subject to change. The use of this website constitutes acceptance of our user agreement. Please read our privacy policy and legal disclaimer.
Trading foreign exchange on margin carries a high level of risk and may not be suitable for all investors. The high degree of leverage can work against you as well as for you. Before deciding to trade foreign exchange you should carefully consider your investment objectives, level of experience and risk appetite. The possibility exists that you could sustain a loss of some or all of your initial investment and therefore you should not invest money that you cannot afford to lose. You should be aware of all the risks associated with foreign exchange trading and seek advice from an independent financial advisor if you have any doubts.
Opinions expressed at FXStreet are those of the individual authors and do not necessarily represent the opinion of FXStreet or its management. FXStreet has not verified the accuracy or basis-in-fact of any claim or statement made by any independent author: errors and omissions may occur. Any opinions, news, research, analyses, prices or other information contained on this website, by FXStreet, its employees, clients or contributors, is provided as general market commentary and does not constitute investment advice. FXStreet will not accept liability for any loss or damage, including without limitation to, any loss of profit, which may arise directly or indirectly from use of or reliance on such information.