
Top 3 Price Prediction Bitcoin, Ethereum, Ripple: Possible start of a trend reversal for BTC – FXStreet
![]() Lockridge Okoth
Lockridge Okoth
FXStreet
Bitcoin (BTC) price is leading markets into weekend mode where trading volumes are low and, therefore, the price becomes susceptible to volatility. With altcoins awaiting the BTC cue, Ethereum (ETH) and Ripple (XRP) prices appear to have taken a hint.
Also Read: Bitcoin Weekly Forecast: BTC likely to correct to $50,000 soon
Bitcoin is the largest cryptocurrency by market capitalization, a virtual currency designed to serve as money. This form of payment cannot be controlled by any one person, group, or entity, which eliminates the need for third-party participation during financial transactions.
Altcoins are any cryptocurrency apart from Bitcoin, but some also regard Ethereum as a non-altcoin because it is from these two cryptocurrencies that forking happens. If this is true, then Litecoin is the first altcoin, forked from the Bitcoin protocol and, therefore, an “improved” version of it.
Stablecoins are cryptocurrencies designed to have a stable price, with their value backed by a reserve of the asset it represents. To achieve this, the value of any one stablecoin is pegged to a commodity or financial instrument, such as the US Dollar (USD), with its supply regulated by an algorithm or demand. The main goal of stablecoins is to provide an on/off-ramp for investors willing to trade and invest in cryptocurrencies. Stablecoins also allow investors to store value since cryptocurrencies, in general, are subject to volatility.
Bitcoin dominance is the ratio of Bitcoin’s market capitalization to the total market capitalization of all cryptocurrencies combined. It provides a clear picture of Bitcoin’s interest among investors. A high BTC dominance typically happens before and during a bull run, in which investors resort to investing in relatively stable and high market capitalization cryptocurrency like Bitcoin. A drop in BTC dominance usually means that investors are moving their capital and/or profits to altcoins in a quest for higher returns, which usually triggers an explosion of altcoin rallies.
Bitcoin (BTC) price has recorded a steady series of lower highs and lower lows over the past four days, suggesting a clear directional bias. However, this is subject for confirmation considering that the $50,638 support level continues to hold. A break and close below it would confirm the continuation of the downtrend, likely sending BTC to $50,000.
The Relative Strength Index (RSI) has already executed a selling signal by crossing below the signal line (yellow band). This is reinforced by the histogram bars of the Awesome Oscillator (AO), which are steadily edging toward the midline.
In addition, based on the Mean Reversion Channel (MRC) indicator principle that holds that price tends to return to its average over time, the market is leaning to the downside.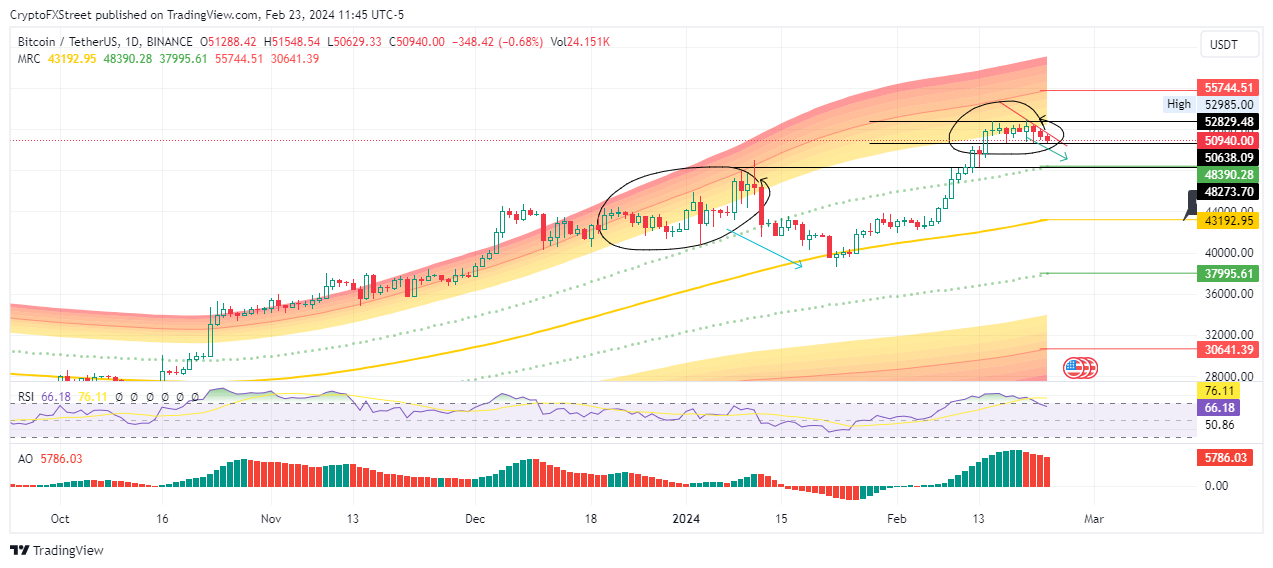
BTC/USDT 1-day chart
On the flip side, if buyer momentum increases, Bitcoin price could push north, escaping the market range above $52,829. In a highly bullish case, BTC could shatter the range high at $52,985 before confronting the $53,000 psychological level. A decisive candlestick close above this level would clear the path for an extended move north.
Also Read: Bitcoin price eyes $48,000 as European Central Bank tears down at BTC after spot ETF approval
After a rejection from the $3,000 psychological level, Ethereum price is trading within the ascending parallel channel. However, it risks an extended fall following the execution of a selling signal on the RSI. With the weekend setting in, low trading volumes and the resultant volatility could see ETH retest the $2,874 support. In a dire case, the slump could send the Proof-of-Stake (PoS) token to the $2,770 support confluence between the horizontal line and the midline of the channel.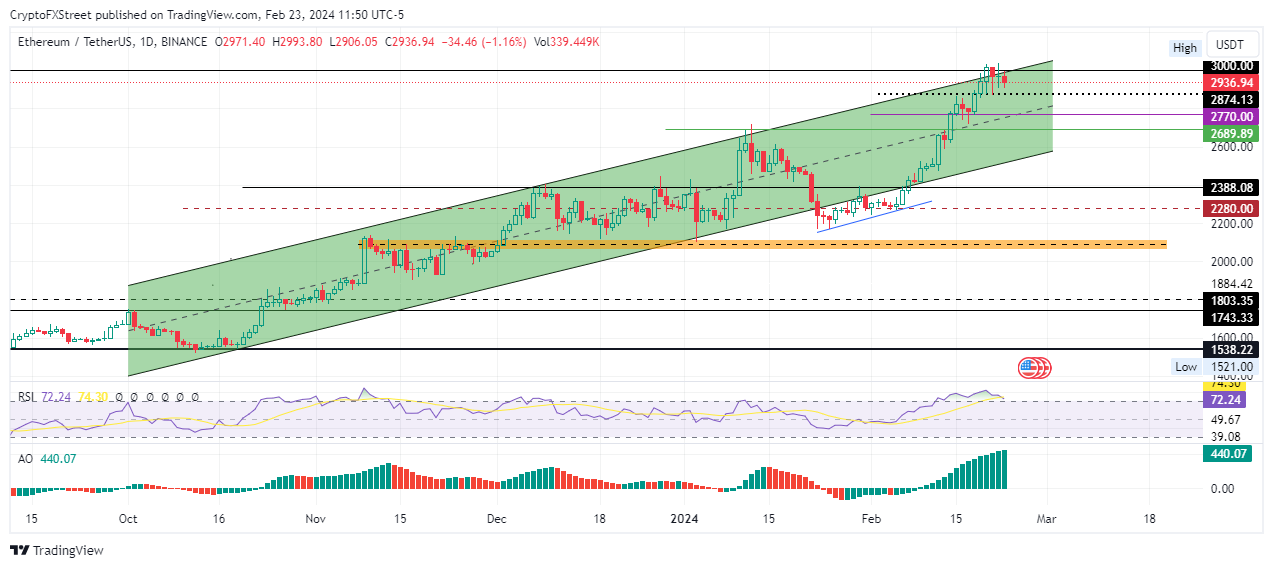
ETH/USDT 1-day chart
However, with the bulls still maintaining a presence in the BTC market, seen with the large volumes of green histogram bars of the AO, Ethereum price could overcome the $3,000 milestone, or in a highly bullish case, clear the range high of $3,036 to tag the $3,200 milestone.
Also Read: Ethereum price risks decline as increasing exchange supply raises chances of profit taking
Ripple (XRP) price has recorded a series of lower highs and lower lows over the past four days after a rejection from the upper boundary of the descending parallel channel. After crossing below the signal line, the RSI is below 50, showing the market is leaning to the downside. The red histogram bars of the AO accentuate this and add credence to the bearish thesis. In a dire case, Ripple price could roll over to the $0.4734 support floor.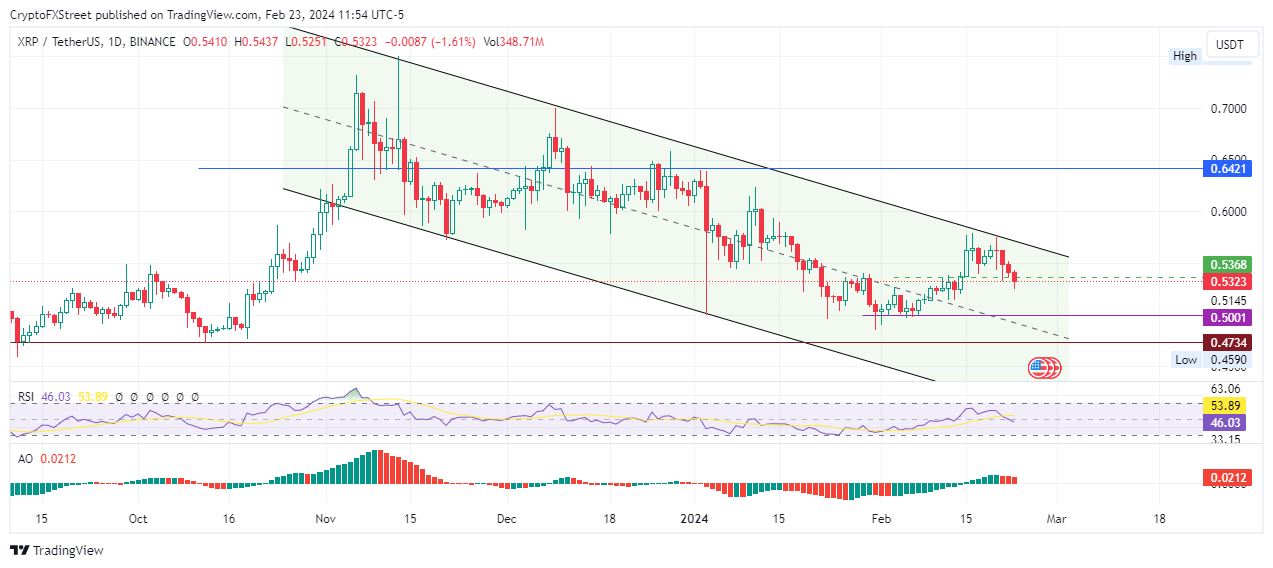
XRP/USDT 1-day chart
On the other hand, enhanced buyer momentum could send Ripple price above resistance stemming from the upper boundary of the channel, with a decisive candlestick close above it setting the pace for an extension to $0.6000. Such a move would constitute a 12% climb above current levels.
Also Read: XRP price plunges as Kraken cites SEC v. Ripple lawsuit in its legal battle against the regulator
Information on these pages contains forward-looking statements that involve risks and uncertainties. Markets and instruments profiled on this page are for informational purposes only and should not in any way come across as a recommendation to buy or sell in these assets. You should do your own thorough research before making any investment decisions. FXStreet does not in any way guarantee that this information is free from mistakes, errors, or material misstatements. It also does not guarantee that this information is of a timely nature. Investing in Open Markets involves a great deal of risk, including the loss of all or a portion of your investment, as well as emotional distress. All risks, losses and costs associated with investing, including total loss of principal, are your responsibility. The views and opinions expressed in this article are those of the authors and do not necessarily reflect the official policy or position of FXStreet nor its advertisers. The author will not be held responsible for information that is found at the end of links posted on this page.
If not otherwise explicitly mentioned in the body of the article, at the time of writing, the author has no position in any stock mentioned in this article and no business relationship with any company mentioned. The author has not received compensation for writing this article, other than from FXStreet.
FXStreet and the author do not provide personalized recommendations. The author makes no representations as to the accuracy, completeness, or suitability of this information. FXStreet and the author will not be liable for any errors, omissions or any losses, injuries or damages arising from this information and its display or use. Errors and omissions excepted.
The author and FXStreet are not registered investment advisors and nothing in this article is intended to be investment advice.
Join Telegram
Join Telegram
PEPE’s social dominance and relevance have been increasing since February 20. This week, top cryptocurrency exchanges have shared PEPE and related memes in tweets on their official X handle.
SEI and Omni Foundation could help NFTs across the Ethereum ecosystem transition to scaling solutions and rollups. The two have proposed a new token standard, xERC-721, with a “code minimized” upgrade to the current standard.
Bitcoin price has formed a potential top signal that forecasts a sell-off. The weekly chart also points to a bearish divergence, which adds credence to the bearish outlook. Investors can expect BTC to consolidate between the $52,062 to $45,160 levels.
XRP price inches closer to support at $0.52 after the recent developments related to the SEC’s lawsuit against Ripple. Kraken cited a key part of the SEC’s lawsuit against Ripple that could impact the outcome of its own legal battle against the regulator.
Bitcoin price has formed a potential top signal that forecasts a sell-off. The weekly chart also points to a bearish divergence, which adds credence to the bearish outlook. Investors can expect BTC to consolidate between the $52,062 to $45,160 levels.
Note: All information on this page is subject to change. The use of this website constitutes acceptance of our user agreement. Please read our privacy policy and legal disclaimer.
Trading foreign exchange on margin carries a high level of risk and may not be suitable for all investors. The high degree of leverage can work against you as well as for you. Before deciding to trade foreign exchange you should carefully consider your investment objectives, level of experience and risk appetite. The possibility exists that you could sustain a loss of some or all of your initial investment and therefore you should not invest money that you cannot afford to lose. You should be aware of all the risks associated with foreign exchange trading and seek advice from an independent financial advisor if you have any doubts.
Opinions expressed at FXStreet are those of the individual authors and do not necessarily represent the opinion of FXStreet or its management. FXStreet has not verified the accuracy or basis-in-fact of any claim or statement made by any independent author: errors and omissions may occur. Any opinions, news, research, analyses, prices or other information contained on this website, by FXStreet, its employees, clients or contributors, is provided as general market commentary and does not constitute investment advice. FXStreet will not accept liability for any loss or damage, including without limitation to, any loss of profit, which may arise directly or indirectly from use of or reliance on such information.